November 2026 | ForwardDMV Research Insights
New Kaptivate analysis for ForwardDMV tracks two years of federal contractor activity across the region and finds exits were highest among small contractors, those that stopped winning new work, and those whose main customer was USAID.
The Washington region runs on federal contracting, and when federal priorities shift, its contractors feel it first. Over the past two years, 12 of the 8,803 DMV federal contractors we tracked filed for bankruptcy. More than 600 others quietly exit by letting their federal registration lapse.
That quiet exit is the part of the story bankruptcy numbers miss, and who left matters as much as how many. Kaptivate tracked 8,803 federal contractors across ten DMV jurisdictions from November 2024 to November 2026. Most are still active. But the exits were concentrated in three groups: contractors that stopped winning new work, the smallest contractors, and those whose main customer was the U.S. Agency for International Development (USAID).
How Contractors Left the Federal Market
Business bankruptcy filings per quarter, Nov 2024–2026. Navy bars are the 12 filings by the 8,803 contractors in this study. Gold bars are 35 filings by other DMV businesses registered for federal work that won no contracts. 2026 Q4 runs through November 4.
Of the 8,803 contractors, 91% (8,003) still held active registrations in November 2026 in SAM.gov, the federal registry required to win and be paid for federal contracts. Another 175 had expired within the previous 90 days and may still renew, so they are counted separately.
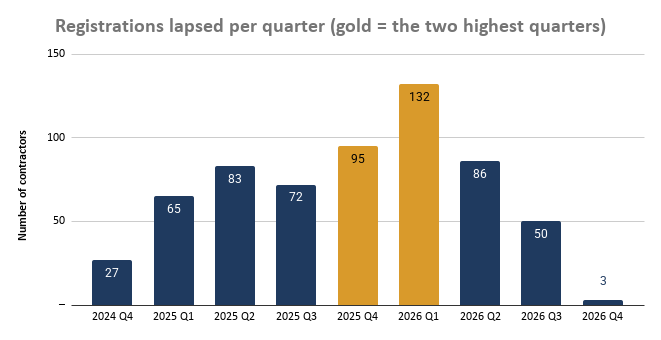
The rest left the federal market, 12 filed for bankruptcy, while 613 let their registration lapse, about 50 for every filing. In this study, a contractor has exited if it filed for bankruptcy or its registration lapsed more than 90 days before November 2026. By that measure, 7.1% exited. And the exits did not slow down: more registrations lapsed in the second year (331) than in the first (282).
A lapsed registration is not the same as a closed business; some firms may have moved to commercial or state and local work. But it does mean they left the federal market, and those exits were concentrated among the smallest contractors and those that stopped winning new federal work. Bankruptcy statistics largely miss this. So do spending totals: the contractors who left held less than 1% of the group’s FY2024 contract dollars. The exits fell on the many small contractors, not the few large ones that account for most federal spending.
Three Groups Were Far More Likely to Exit
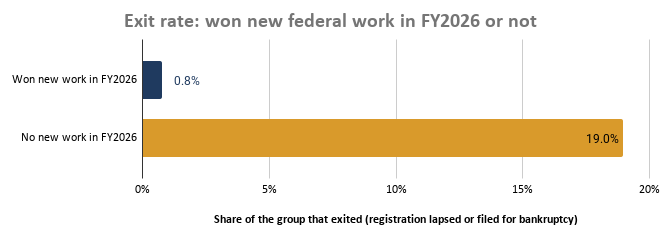
Contractors that won no new work. Among contractors that won new federal work in fiscal year 2026 (October 2025–September 2026), 0.8% exited. Among those that did not, 19% exited. Part of this gap reflects timing: contractors whose registrations lapsed early in the period could not receive new awards. Even so, the difference shows how closely staying in the federal market tracks a steady pipeline of work.
Smaller contractors. Contractors with under $100,000 in FY2024 federal contract dollars exited at 15.3%, against 0.8% for those with $10 million or more. Size here is measured by contract volume, not official small-business status. Smaller contractors likely have less capacity to absorb a lost contract, fund proposals or shift to new markets. 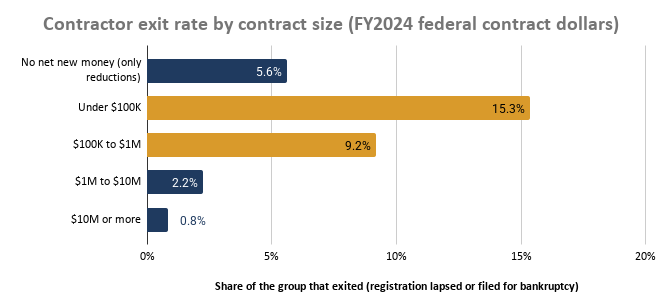
USAID contractors. Among 180 contractors whose largest federal customer was USAID, 44% exited, against 7.1% for all contractors and 4.5% for those whose main customer was the Department of Defense. This lines up with the 2025 cuts to U.S. foreign aid. Most of those who left (70 of 80) were individuals contracting directly with USAID rather than companies; USAID-focused companies exited at about 10%. The impact fell most heavily on independent contractors.
These groups overlap. Many small contractors are individuals, and individuals make up 14% of contractors but about 40% of exits. The three patterns are best read together: the smallest contractors were the most exposed, especially individuals whose main customer was a single agency.
What It Means for the Region
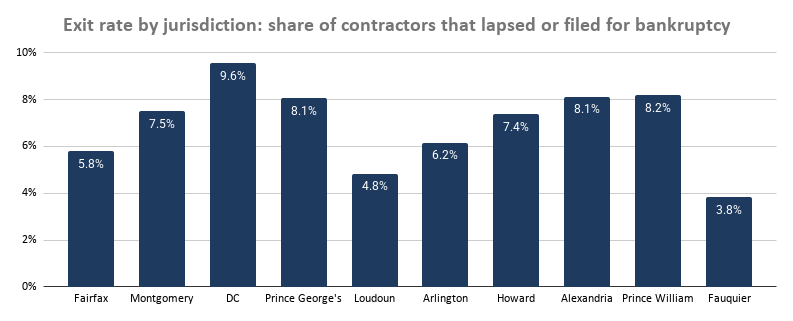
The impact was uneven across the region. DC had the highest exit rate (9.6%), partly because it has the most USAID contractors, who account for about a quarter of DC’s exits. Fauquier had the lowest (3.8%), though it has few contractors.
The data cannot tell us where those contractors went: into commercial markets, other public-sector work, or out of business. That is the question that matters most for the region. What it does show is where reliance on federal work leaves contractors most exposed:
- Dependence on a single agency. When one agency’s funding is cut, the contractors that rely on it are the most exposed, as USAID’s contractors found.
- Dependence on the next award. Contractors that stopped winning new work left at far higher rates.
- Small size. The smallest contractors have the least cushion to absorb a lost contract or move into new markets.
- Individual contractors. Much of the impact fell on independent contractors rather than firms. Their skills don’t disappear when contracts end, but the region may not keep them.
Reducing that exposure means helping the most federally dependent contractors, especially small firms and independent contractors, build business beyond a single agency before the next shift in federal priorities, not after.
Looking Forward: Where Does the Region Go Next?
This analysis shows who left the federal market. The next questions are where they went and how the region can help. Are former contractors finding new markets? Which industries are absorbing their talent? How can regional institutions help smaller businesses become more resilient?
Through ForwardDMV, Kaptivate will continue this work with employers, researchers and workforce leaders. The DMV’s advantage has always been more than its proximity to the federal government. It is the depth of its talent and institutions, and how well those are connected to what comes next.
About the Study
Kaptivate analyzed 8,803 businesses and individuals that held active SAM.gov registrations in November 2024 and won new federal contract money (at least one award with a positive obligation) in FY2024–FY2026. The study covers Fairfax, Arlington, Alexandria, Loudoun, Prince William and Fauquier in Virginia; Montgomery, Prince George’s and Howard in Maryland; and the District of Columbia.
Data sources are SAM.gov, USAspending.gov and CourtListener bankruptcy records. CourtListener coverage of the DC, Maryland and Virginia bankruptcy courts was checked against official U.S. Courts counts and found to be about 98–100%. Registration status is as of November 1, 2026, and bankruptcy filings are counted through November 4, 2026. A contractor’s main customer is the agency that paid it the most contract dollars in FY2024–FY2026. Contractor size is measured by federal contract dollars, not Small Business Administration size status. Individuals are sole proprietors registered in SAM.gov.
Registrations that expired within 90 days of November 2026 are treated separately. A lapsed registration should not be read as a confirmed business closure. The associations in this study do not establish causation. Some late-FY2026 Defense award data were incomplete because of reporting delays.
Research and analysis: Kaptivate for ForwardDMV